
Binance Coin has gained the stature of one of the market-leading cryptocurrencies after taking a 5000% rally since 2020 to its all-time high of $690.93. Keeping aside the stable coins from the market capitalization ranking, BNB would place at the third spot with its whopping $62 billion of market value.
The fall of BNB couldn’t be predicted at its all-time high value since the entire crypto space was positive. BNB will soon be incorporating smart chains into the smart contract developing ecosystem, helping dApps and other state-of-the-art technologies.
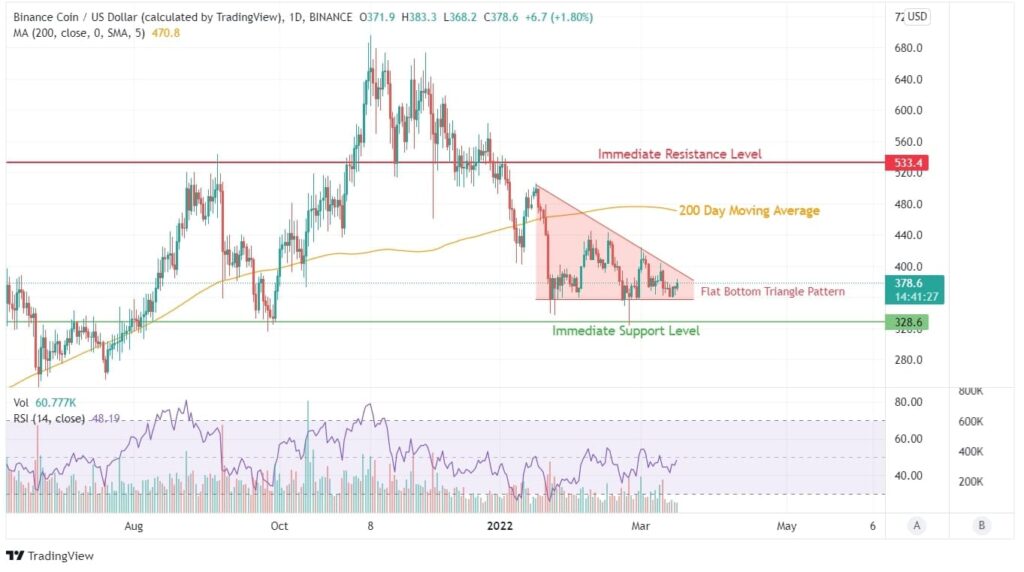
Looking at the price trend concerning previous trading patterns of BNB, February and March 2022 has added in the buying action. However, it’s still not substantial enough to breach its immediate resistance levels. The flat bottom or descending triangle pattern developed since 2022 indicates a negative momentum in BNB. Despite the trend of getting just a single line of support without sudden buying trends, $350 becomes a strong pivot for such a possibility.
At present, even the 200 Days Moving Average is placed around $450 is a strong resistance level for buying trends. It would be relatively easier for BNB to jump higher after the 200 DMA curve falls a bit low.Backed by the substantial buying range of $330 – $350, BNB will be in a better place for breakout buying trends in the coming months. RSI levels seems to have hit the roof at 55, which is a mildly positive buying trend, which should last till RSI hit 80 on its histogram charts. Click here to read the BNB price prediction for the next few years.
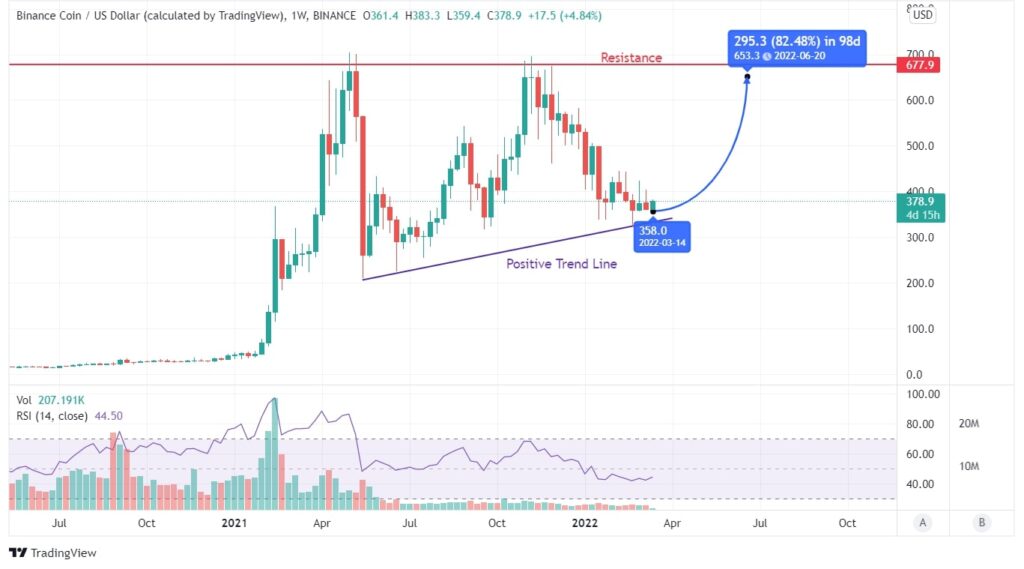
In the long term, BNB’s technical strength is visibly stronger, with a potential of moving up by 82% in the next three months. Growing blockchain ecosystem and deeper penetration of Binance in the crypto space will eventually transform to BNB valuation.
The trend line since the dip of April 2021 seems to hit bottom at $330. Since BNB has been taking a positive movement from this trend line, there is a higher probability of this price action repeating. RSI can be seen moving lower than November 2021 levels, but the lower price justifies this indication.
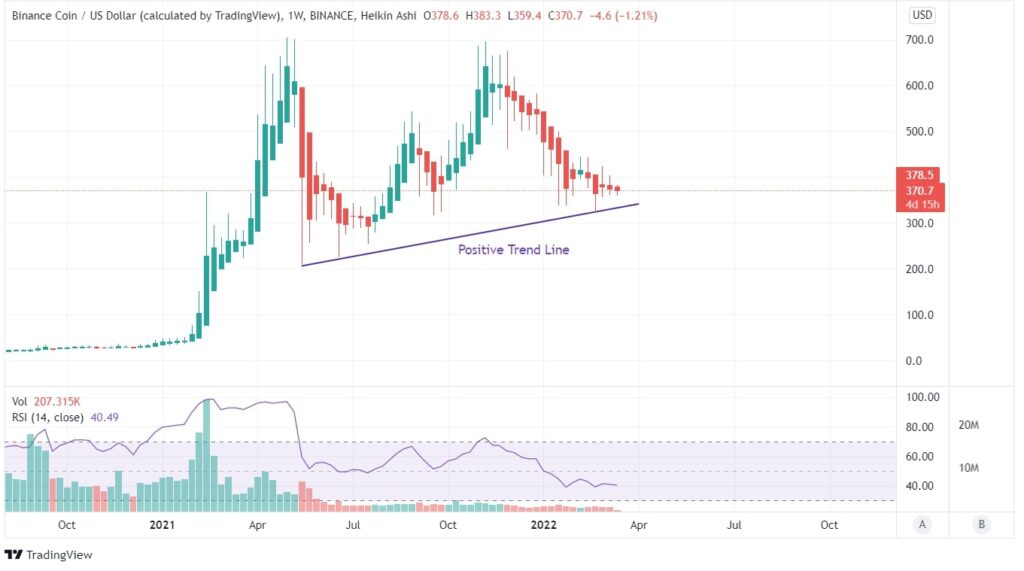
Hiken-Ashi charts indicate the starting and ending of a trend cycle. We can identify the trend change in November 2021, followed by the initiation of upper wicks on red candles. Similarly, the decreasing candle size and relevant wicks on red candles show potential for trend reversal.
Ideally, one should wait for a green Heiken Ashi candle without any lower wicks to confirm the positive trend. But waiting for such confirmation will lead to missing out on the current return potential of BNB.


